Building Plurit's Design System
2025 - Present
B2b
Figma, Figma Make
Project Overview
This is the design source of truth for Plurit’s product UI. This initiative documents its foundations (color, typography, spacing) and captures the original prototype — a Security Service Edge vendor comparison experience — as static, reference-ready screens inside the Plurit Figma file.The goal is to bridge design and engineering: a shared token set, documented styles, and pixel-accurate screen references that teams can use for build, review, and handoff.
This is an ongoing project and will only be able to provide a high-level overview.
This is an ongoing project and will only be able to provide a high-level overview.
My Contributions:
Research Analyzed user pain points, mapped information architecture, and explored all major and edge use cases.
Wireframing & Prototyping: Explored low/mid-fidelity wireframes in Google Stitch. Exported screens to Figma for variable adjustments. Figma Make for building the live prototype.
Design Systems Development: Built component library (tokens, icons, chips) and design patterns from scratch for scalability and accessibility.
Before and After: Plurit UI
Before
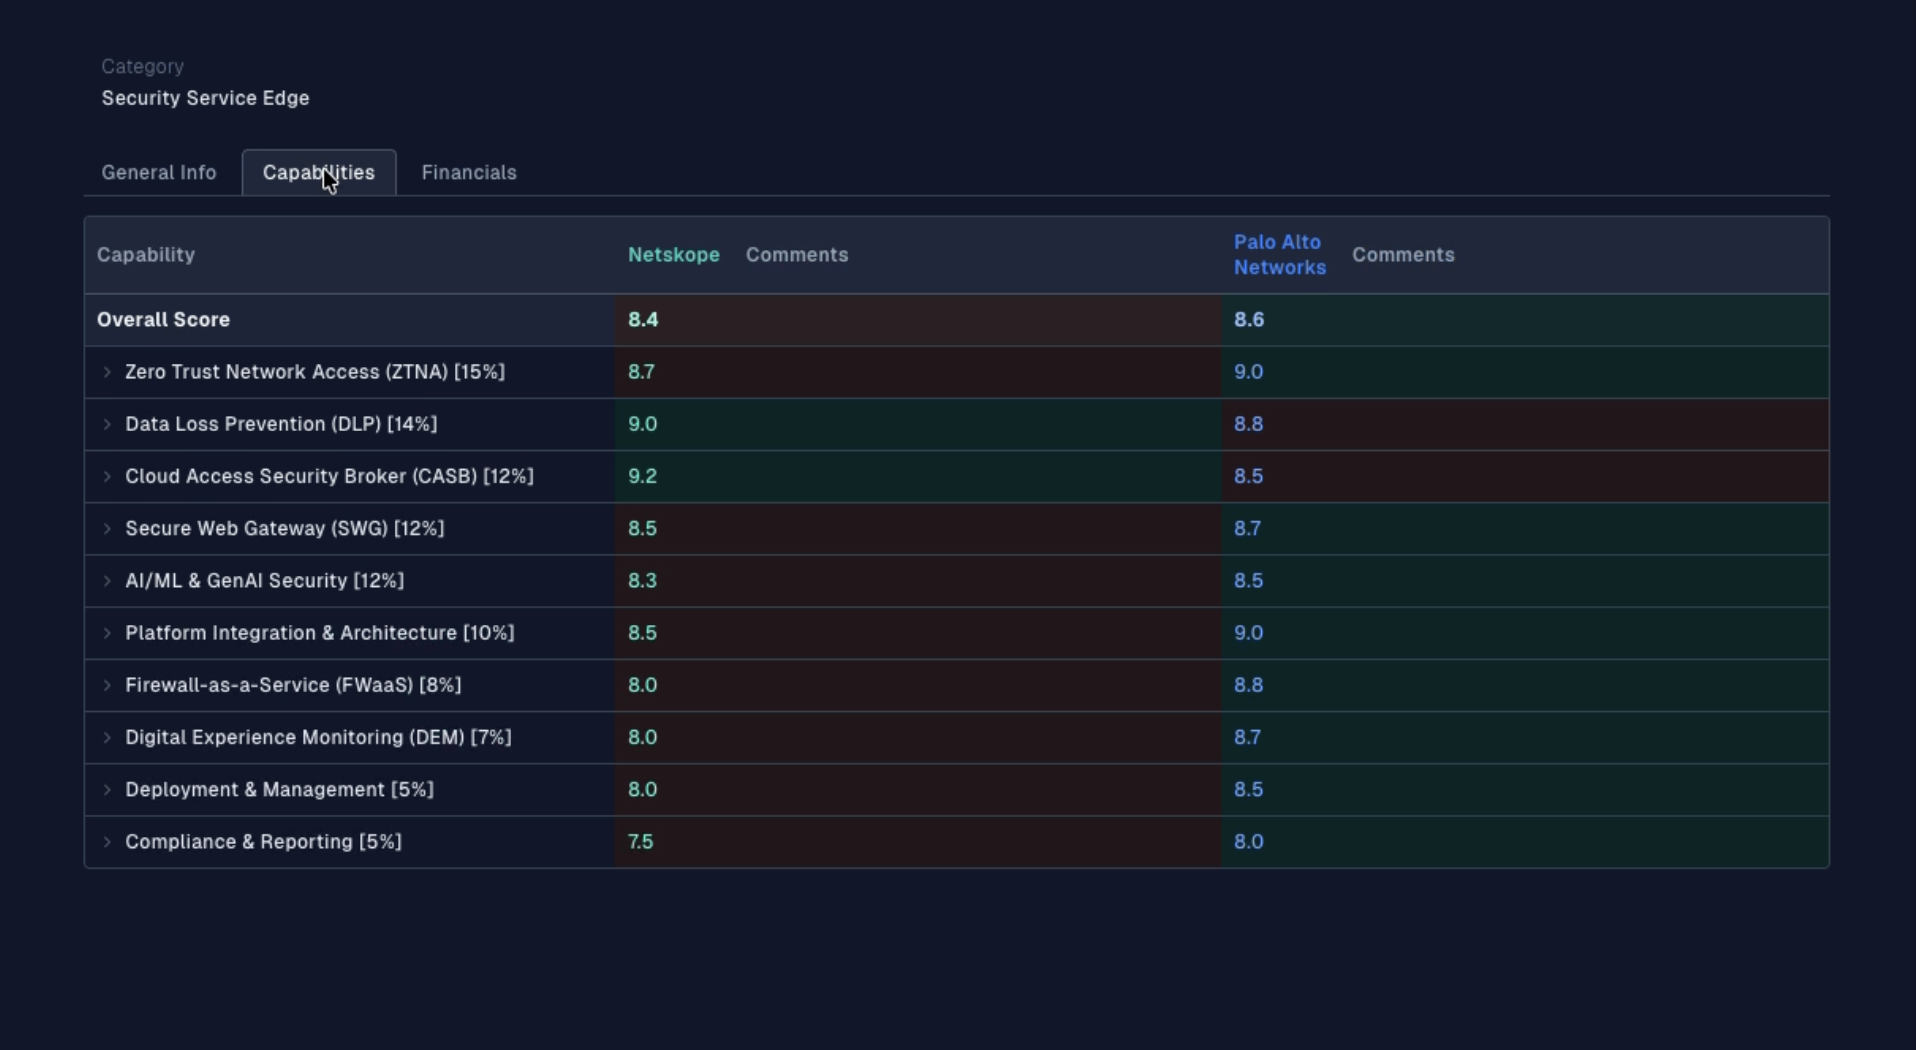
Initial prototype created by engineers. Comprehensive data, but difficult to navigate, and scores were buried - requiring significant scrolling to compare data.
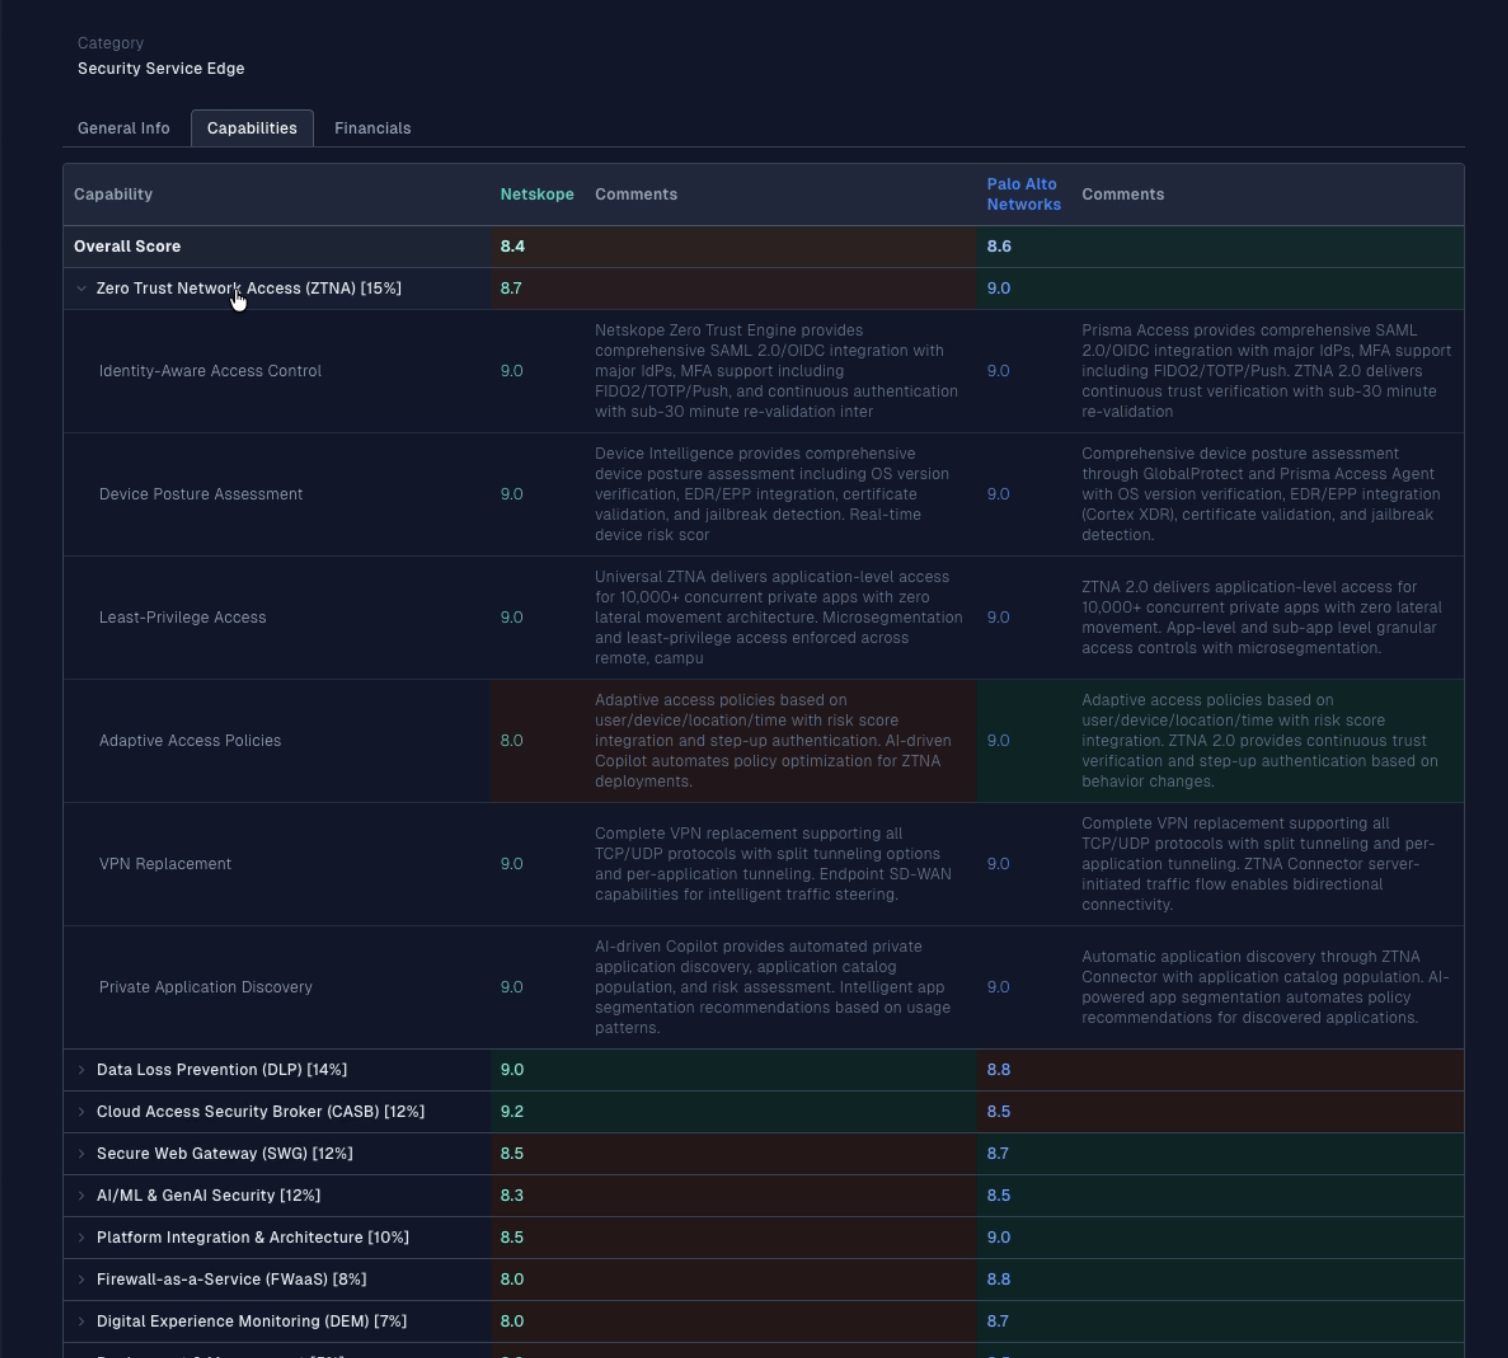
No filtering or sorting — there's no way to narrow vendors by score range or rank them, so finding the best option requires manually reading every row.
After
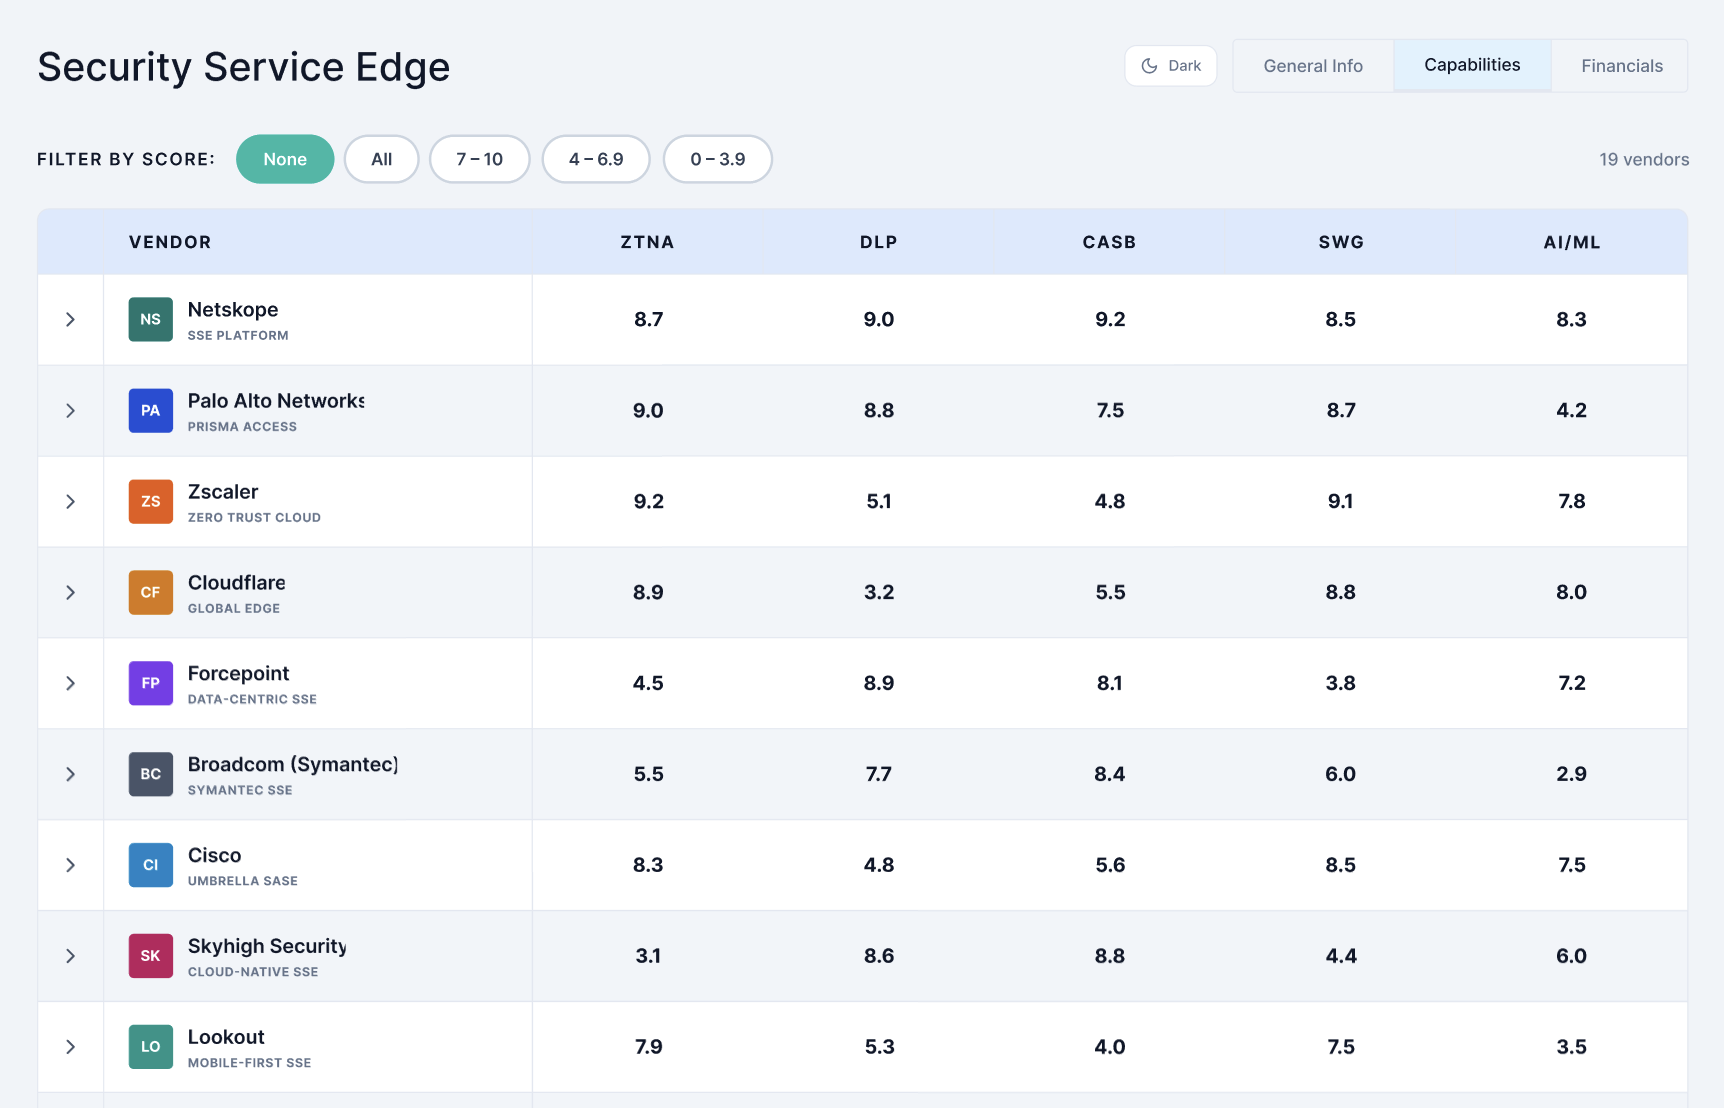
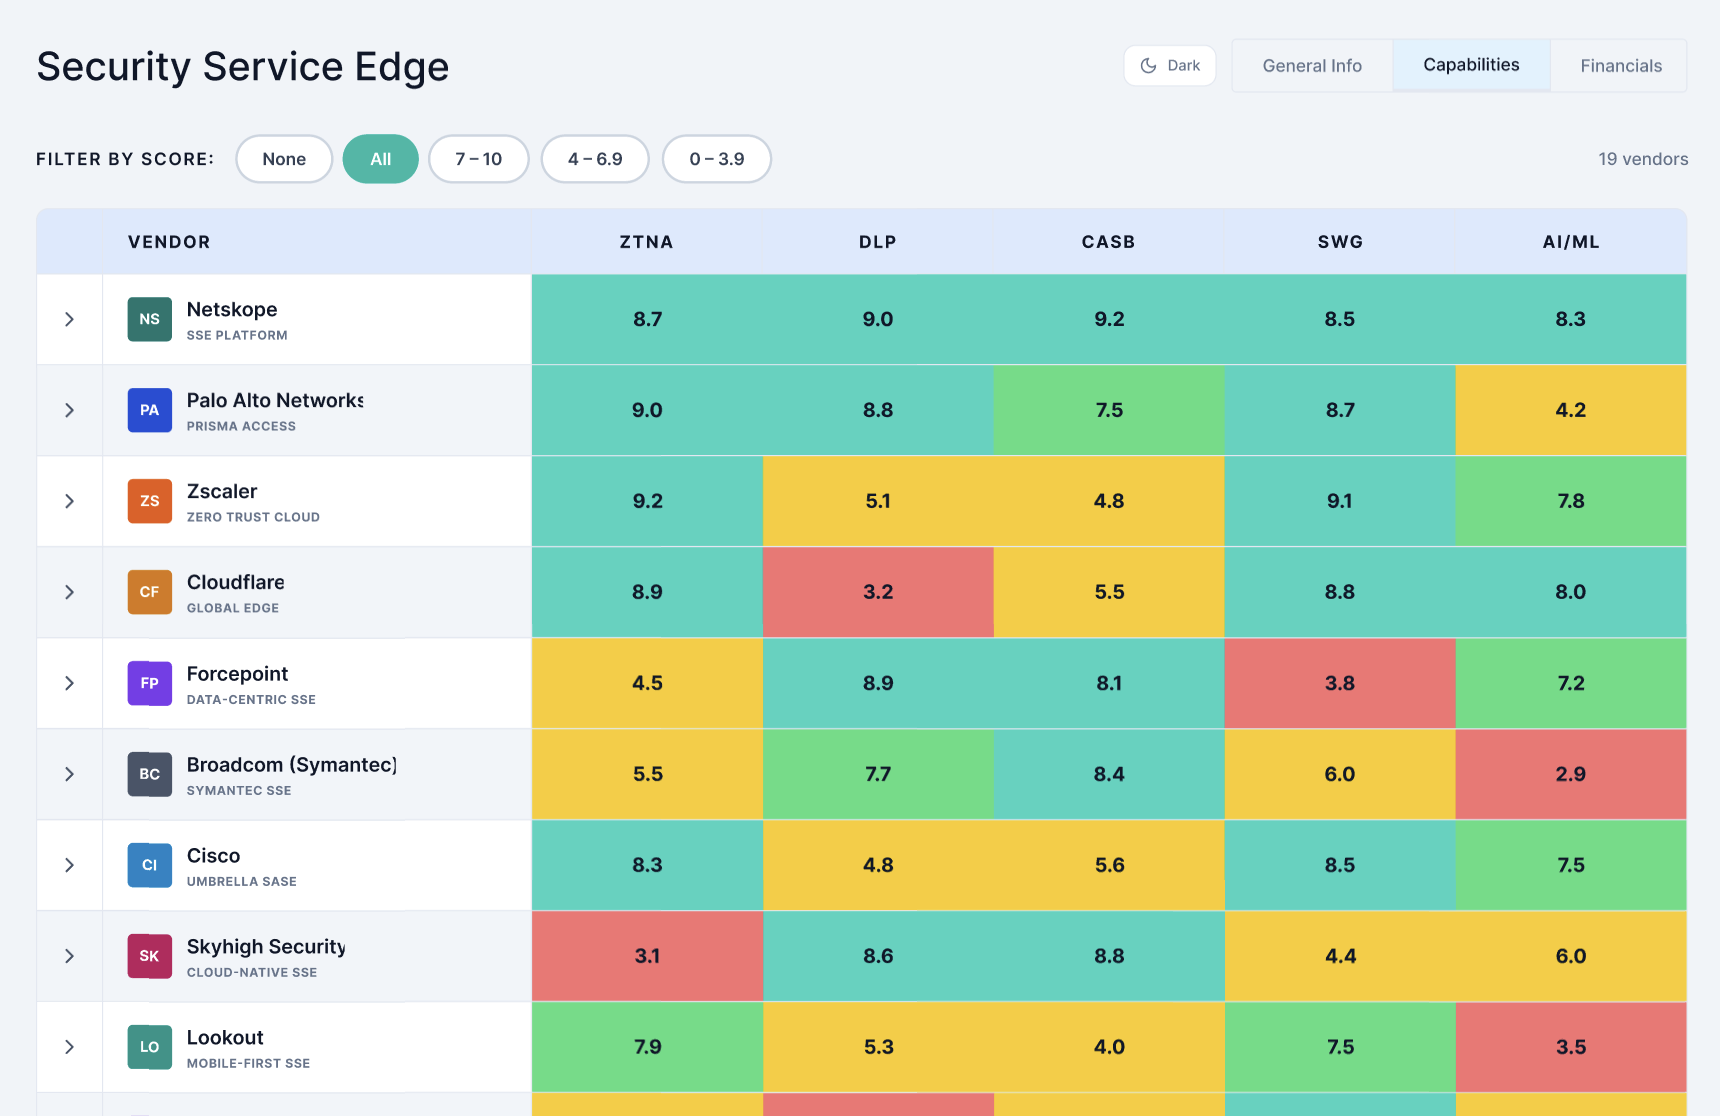
Built and prototyped by me. Cleaner layout, faster navigation, and scores users can actually scan without digging through commentary.
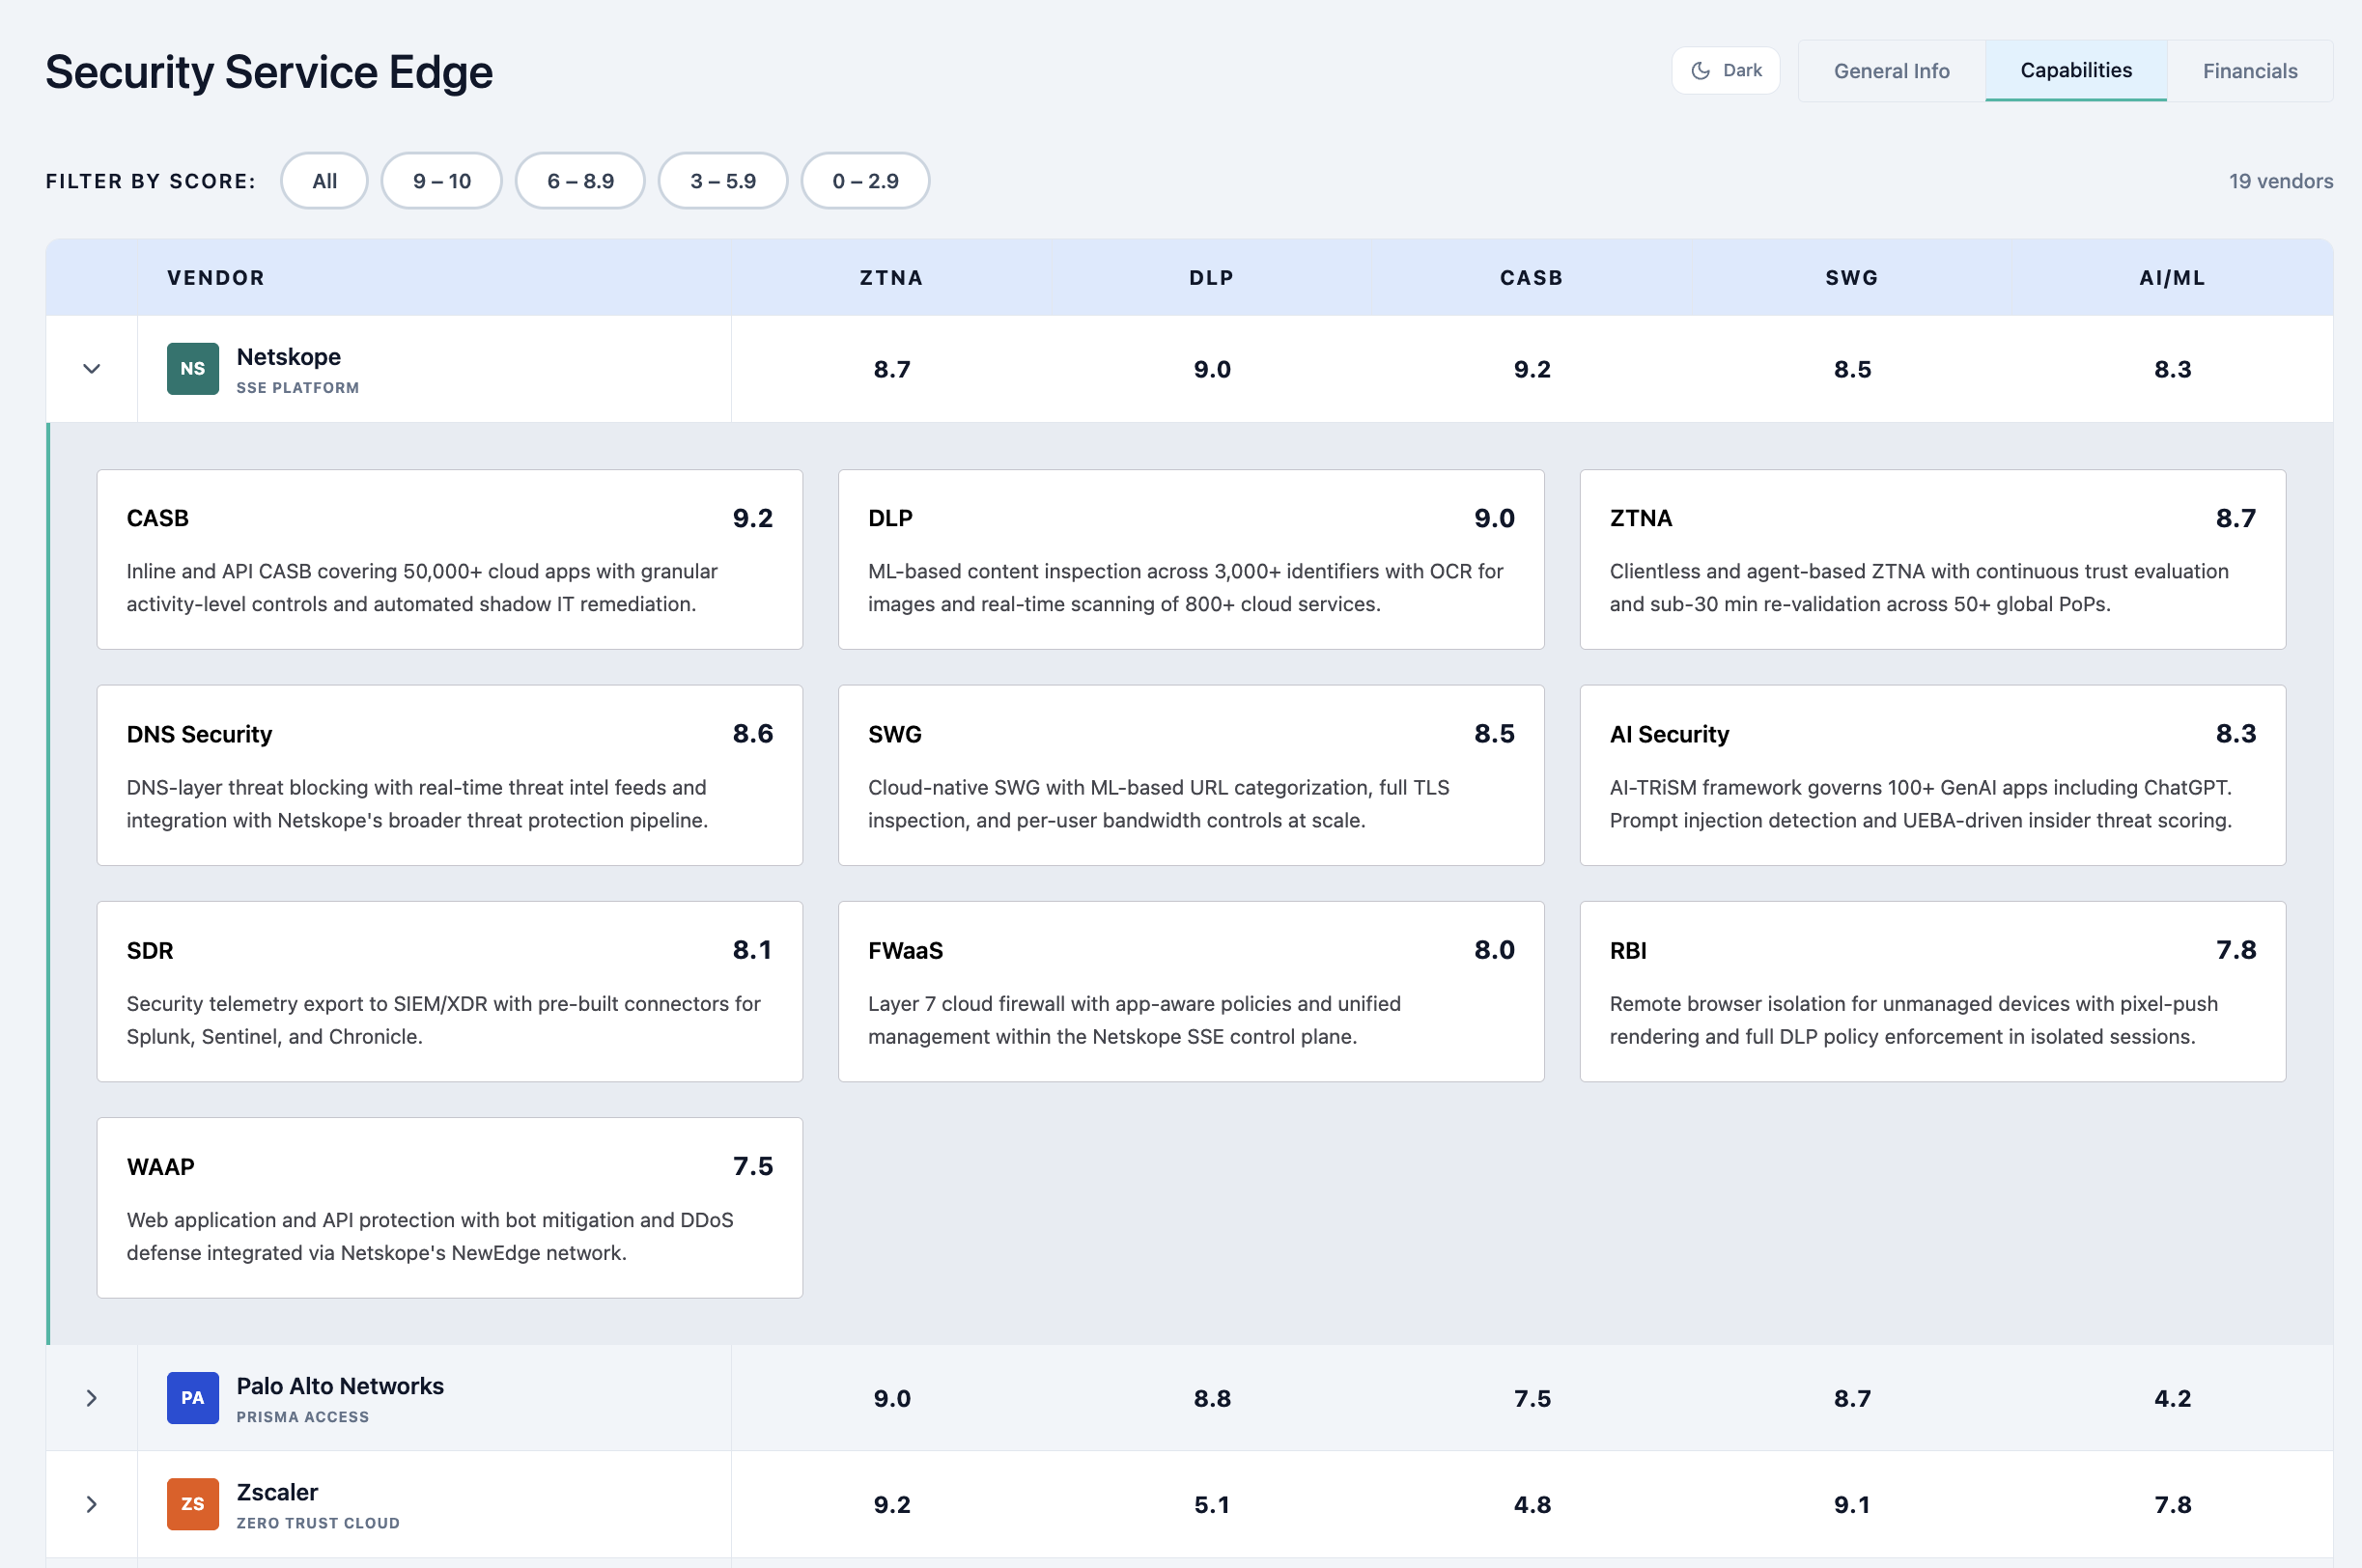
Each vendor row is now interactive and clicking it expands to reveal a full breakdown of how the score was calculated across individual capability subcategories.
Crafting Plurit Inc's Visual System
I built the Plurit design system from scratch in Figma — defining components, design tokens, and usage guidelines from the ground up. The components documented below are all active in production, powering the heat mapping table interfaces.
Building Plurit's Chart Systems
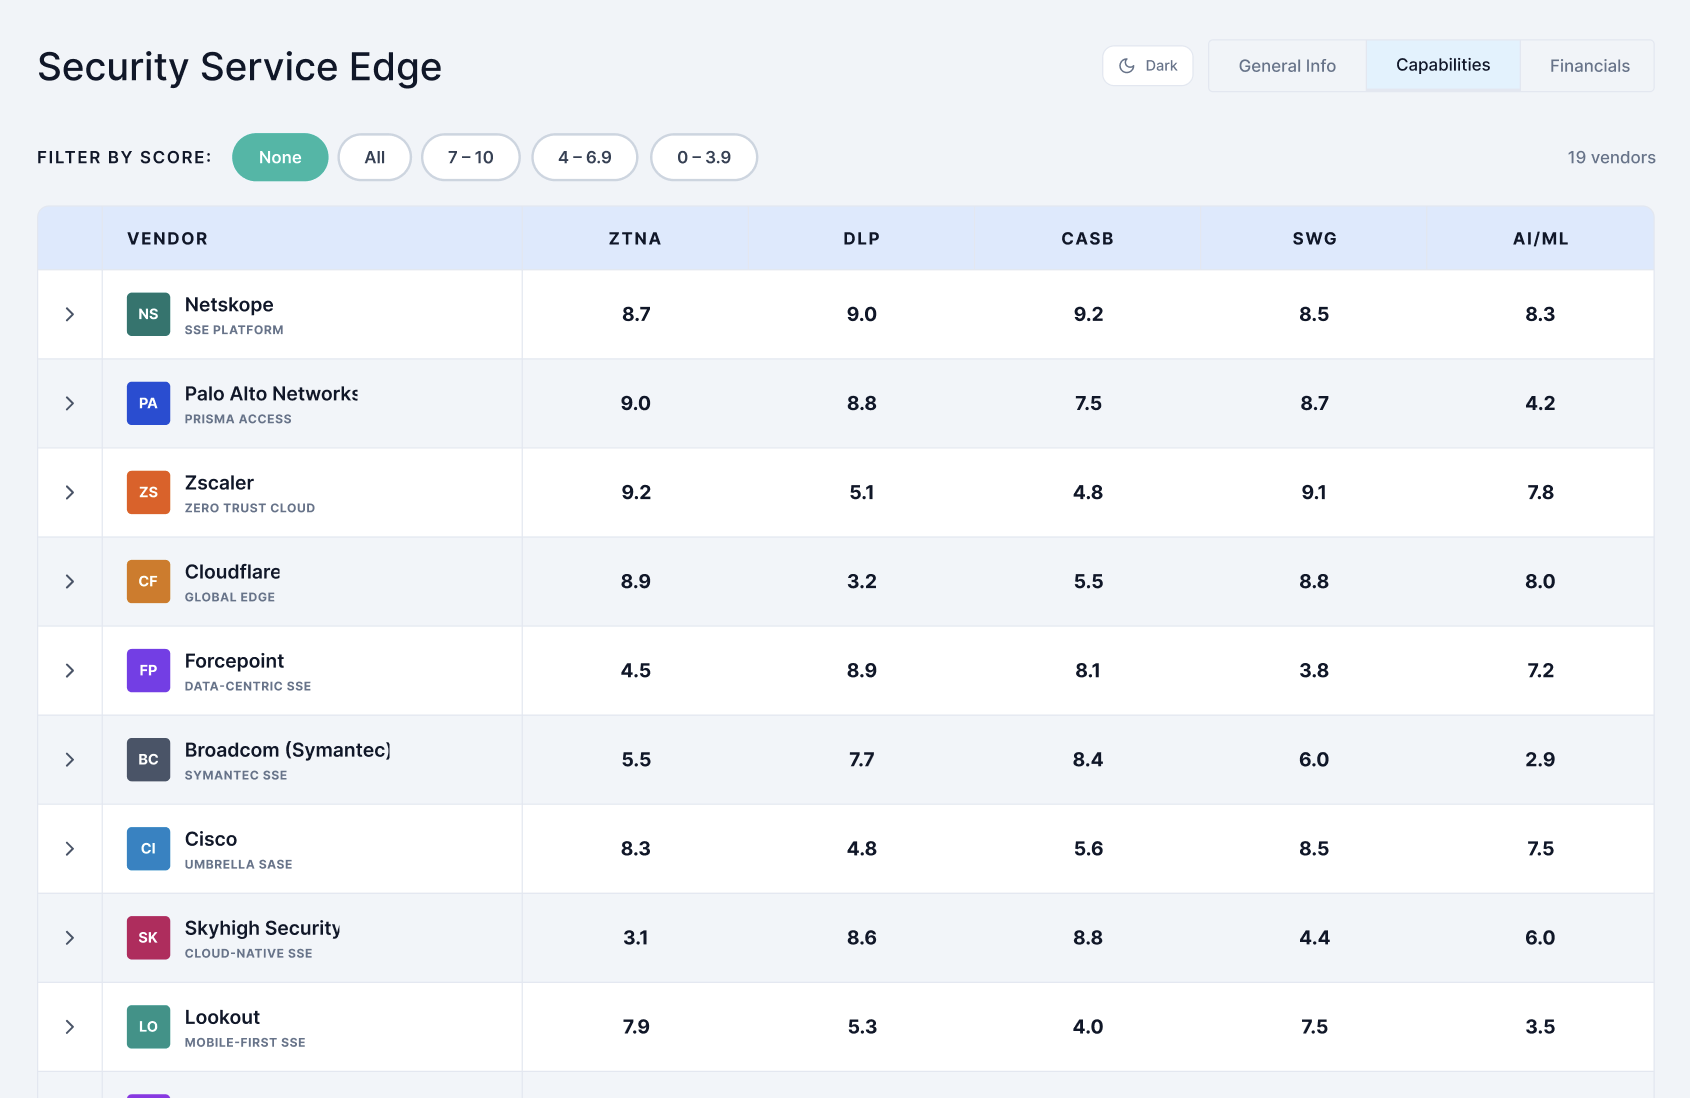
The Capabilities tab uses a score-filtered heat table — vendors are ranked across security dimensions (ZTNA, SWG, etc), with color encoding that shifts from green to red as scores drop.
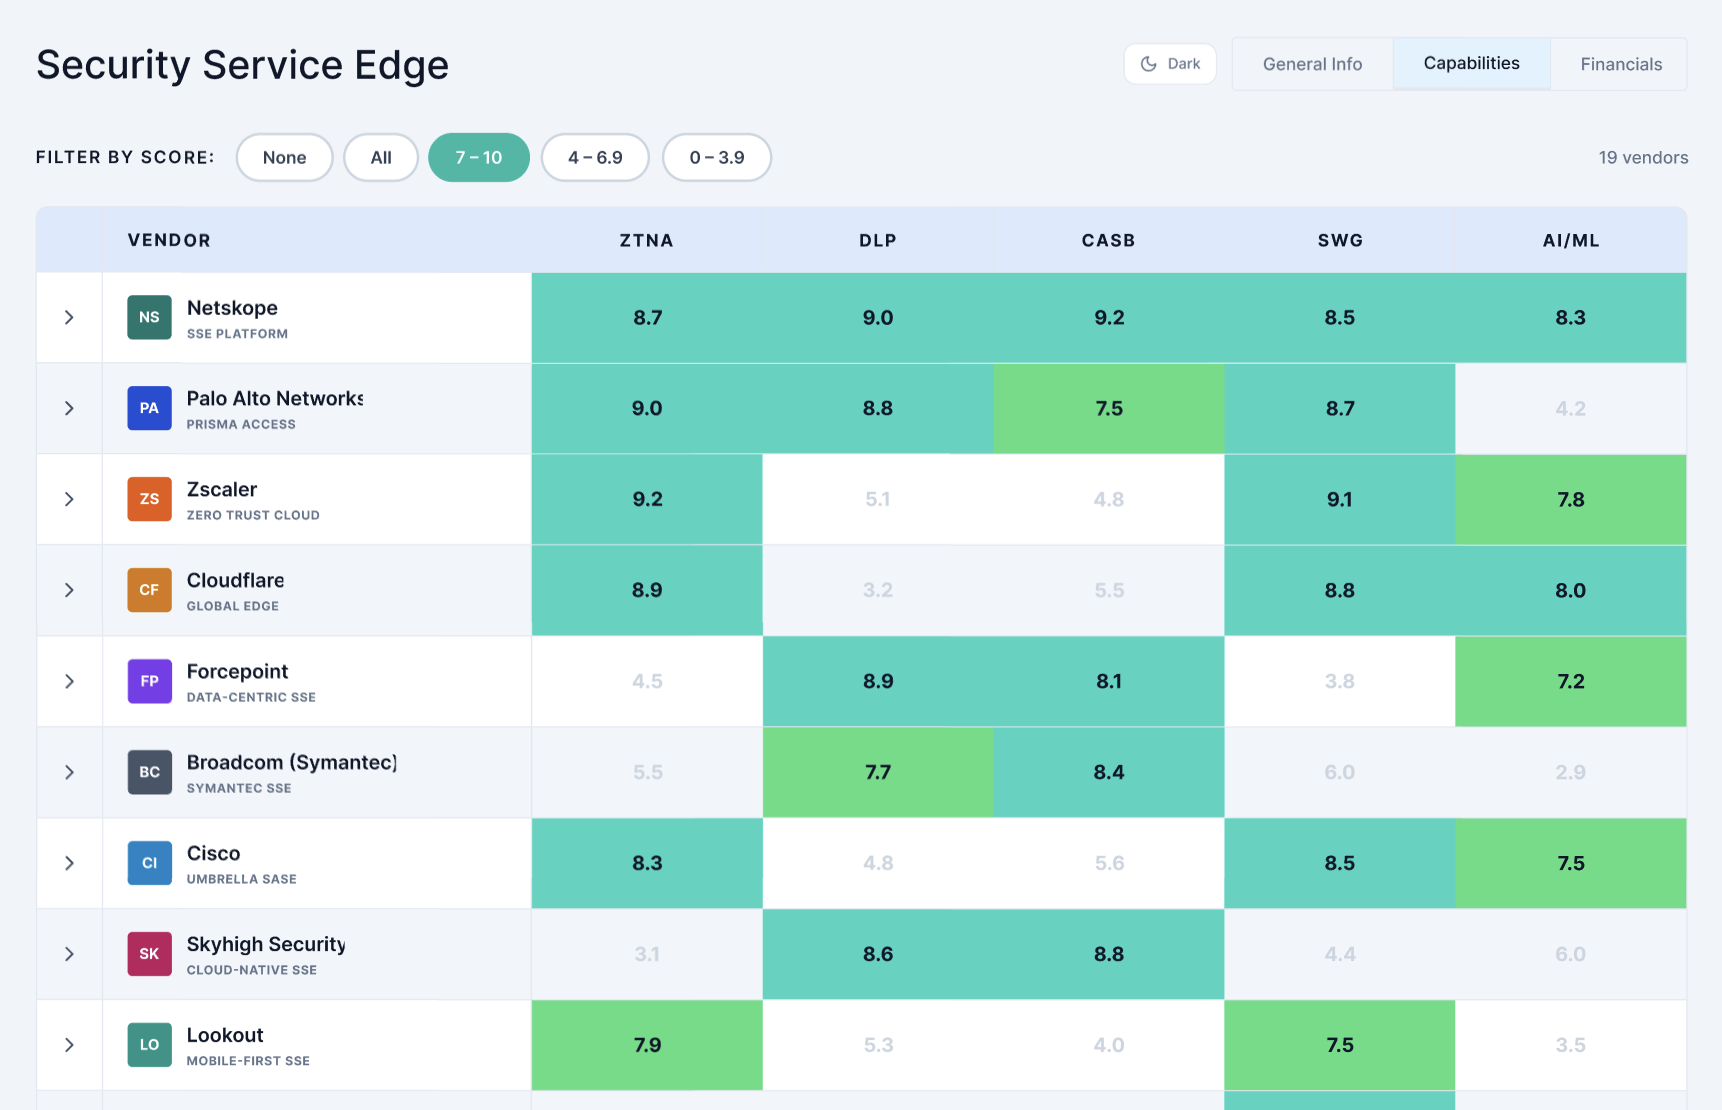
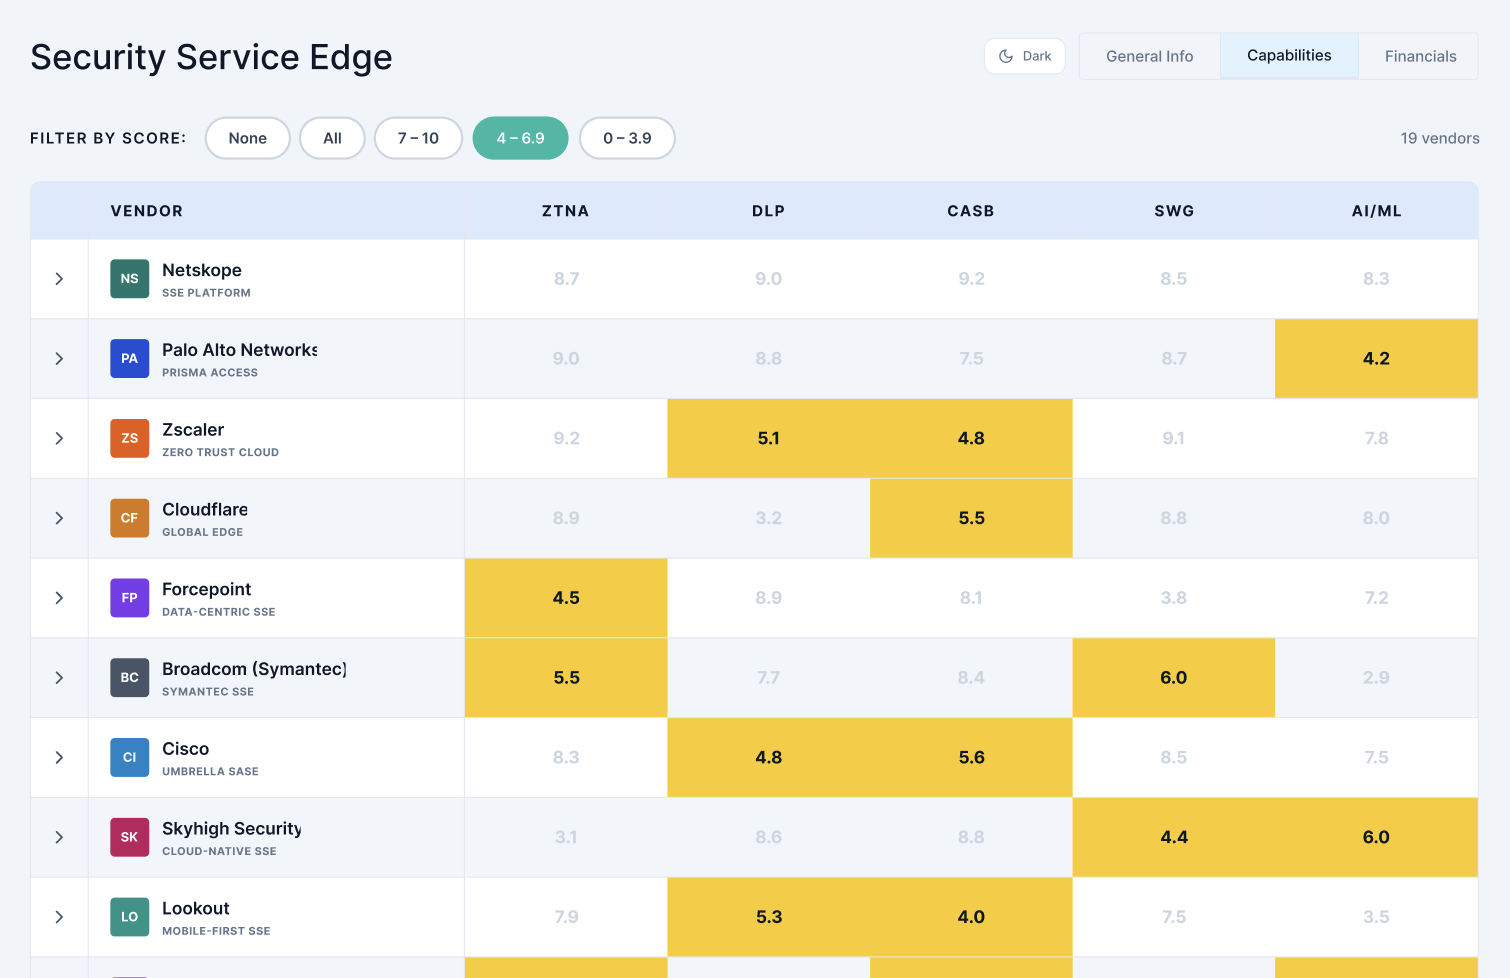
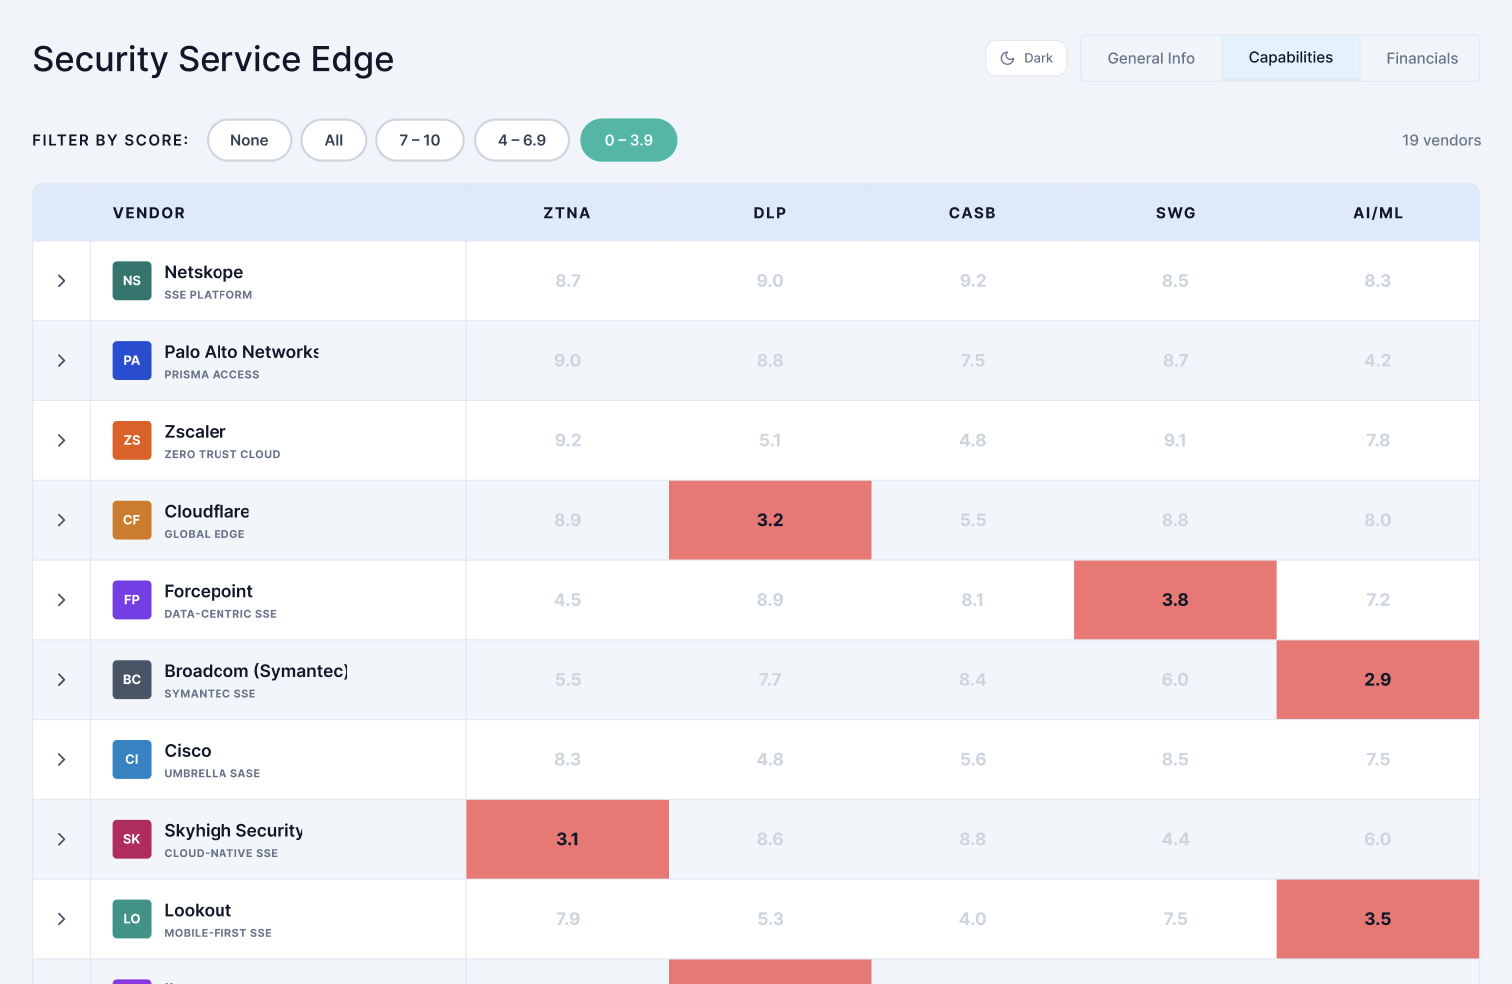
Filtering by score range highlights qualifying cells, letting analysts instantly isolate top-tier or underperforming vendors without reading row by row.
Filtering by score range highlights qualifying cells, letting analysts instantly isolate top-tier or underperforming vendors without reading row by row.